There are many examples of using technology to gather data about motion. For example, police use radar to determine how fast cars are traveling. Just as the radar detector uses radio waves to determine the speed of a car, the sonar ranger uses the speed of sound waves to determine speed and distance.
A sonar ranger uses a motion detector that sends out high frequency sound waves to a target object and waits for it to come back. The sonar ranger measures the time needed for the wave to leave and return to the detector. The software determines and displays the distance the pulse covered based on the speed of sound.
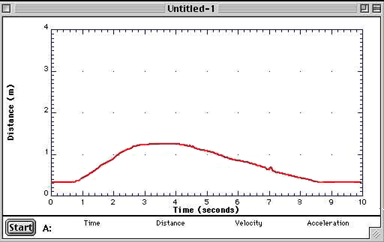
The graph below is an example of a distance-time graph captured as a student walked a straight line with their back to the sound pulse from a sonar ranger. With a partner determine the portion of the graph that indicates walking away from the detector, toward the detector, and standing still. What do you notice about the shape of the line in each case? Can you tell when there is faster or slower motion?

Can you match your motion to that shown on a graph? Go to "Investigations" to try it out.
![[back]](../images_nav/but-back.gif)
![[go to activity contents]](../images_nav/but-contents.gif)
![[next]](../images_nav/but-next.gif)


