 mobile inquiry technology
Matching Motion Teacher Notes
Discussion Guide
Ask the students to imagine they are a marine biologist. You want to track the movements of whales in the ocean. What information about the movements of the whale would you want to know? (Answers might include: where the whale is, or position, how fast it is travelling, and at what depth it is swimming) Ask the students how they might track a whale?
Propose to the class that there is technology that helps scientists answer these questions. Show the class the sonar ranger. Ask the class if anyone has heard of sonar. Some examples students might mention include ships using sonar to find objects at the bottom of the ocean or a sonogram to "view" a fetus as it is developing. Explain that sonar devices use the time it takes sound to travel to and from an object to determine the distance of the object from the source. This is possible because we know the speed of sound. The data that the sonar device collects is usually represented in a distance-time graph. Ask the students to share examples of other distance-time graphs that they have seen or made.

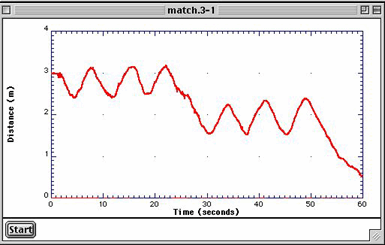
On an overhead, show the class the example of the distance-time graph above that shows a change in speed and a change in direction. Show how the axes describe the motion in meters and seconds. Indicate that this is a graph of the movement of an imaginary whale. Ask each group to write down as many facts as they can determine from the graph about the motion of the whale. (The whale moves back and forth between three and two meters away from you for twenty-five seconds. Around that time the whale moves back and forth between two and one half meters and one and one half meters from you. Eventually the whale moves within three quarters of a meter of you. The speed and direction of the whale is changing over time.)
After about 10 minutes hold a brief discussion to permit the group to share their stories.
Direct the students to read the "Thinking About the Question" section. (See "Additional Teacher Background" for an explanation of the graph shown in "Thinking About the Question".) After the groups have had an opportunity to read and share their thoughts, hold a brief discussion with the entire class. Focus the discussion on how graphs represent changes in position, direction, and speed. Direct the students to "Investigation I".
Dividing the class into two teams (each with a sonar ranger) is helpful. Refer to Technical Hints to see how to set up the walking track. Allow the two teams time to experiment with the sonar probe. Once the teams have had time to "Mess Around", ask the students to review the first graph. Have the team discuss each movement needed to reproduce the graph. Students should reproduce the distance-time graph and label the motion needed for each portion of the graph.Each team member should be active in the process. One student will need to start the sonar ranger by clicking the trigger and another student will need to walk the track with their back to the sonar. All of the other students should count time out loud to provide a good walking pace. At the end of the first try, compare the graphs of the two teams. Allow the students to repeat several times until they are sure that they know the exact motion needed to reproduce the given graph. Have each group print out their best trial.
After the first graph is successfully produced, switch roles within the group so other students have the chance to be the focus of the motion. Repeat the process for each of the graphs.
The sonar ranger doesn't really measure distance. Instead it measures the time needed for the pulse to leave the sonar ranger and bounce off the target and return to the sonar ranger. The software determines and displays the distance the pulse covered based on the speed of sound.
To obtain reasonable graphs, the surface that the sound pulse bounces off should be flat. This means that the sonar ranger should be pointed at a relatively flat portion of the body. As the sound pulse travels further away from the sonar ranger, it spreads out about 10 degrees. Make sure that nothing else but the object that you are detecting is in the spreading path of the pulse.
After the students answer questions 1 and 2 in the "Analysis" hold a brief discussion to share responses. This might be a possible point when students start to understand their motion. Listen carefully for their use of vocabulary. Key concepts to draw out of the discussion include: how graphs represent changes in speed, direction, and starting point, and the difference between constant and changing speed of motion.
Direct the students to "Investigation II".
Copyright © 1999 Hudson Public Schools and The Concord Consortium, All rights reserved.